If you're running paid social campaigns at any real scale, you already know the line: creative is the new targeting. But knowing you need winning creative is only half the job. The harder half is knowing what's actually working in your existing ads, whether the reporting you're getting back (from an internal team or an agency partner) is actually clear, and whether it's translating into sharper concepts next round instead of more of the same.
Two tools built specifically to solve that keep coming up in conversations with prospective clients: Atria and Motion. Both exist to bridge the gap between media buying and creative strategy, and both get asked about constantly by brands trying to understand how a potential agency partner actually runs reporting behind the scenes, or evaluating whether to bring this kind of tooling in-house themselves.
We've spent a lot of time evaluating how to build client dashboards, report on performance, and feed that data into our own creative production cycle. Our take, upfront: we standardized on Atria, it's the platform running our own reporting stack right now, and for how we work, it's the better tool. Motion still does a few specific things well worth knowing about, and we'll give it a fair shake below, but this isn't a coin-flip comparison for us. Here's the honest breakdown, including exactly why we landed where we did.
Our verdict: Atria. It's what we run our own client reporting and creative strategy on, and it's what we'd point most teams toward unless the need is narrowly deep, granular tagging work with no reporting or research use case attached, that's the one spot where Motion still wins.
The Two Tools, at a Glance
Motion is the more established name in creative analytics. It's built heavily around visual reporting: translating a messy Ads Manager export into clean, digestible cards and charts that both media buyers and creatives can actually read at a glance.
Atria is a hybrid platform. It combines creative reporting and client-facing dashboards with competitor intelligence and creative research tools, built around the full loop: what worked last week, and what to shoot next week because of it.
| Category | Motion | Atria |
|---|---|---|
| Core identity | Deep creative analytics and tagging | End-to-end reporting + research workflow |
| Strongest for | Granular element-level pivoting | Client-ready dashboards + creative research |
| Competitor intelligence | Not a core focus | Built in, integrated with reporting |
| Learning curve | Low for analytics-only use | Slightly higher, more surface area |
| Pricing | Scales with spend/accounts, can get expensive | More accessible at the reporting tier |
| Best fit | Analytics-focused media buying teams | Agencies running a full creative-to-reporting loop |
Where Atria Shines: Closing the Reporting-to-Creative Loop
For our specific use case, Atria won out for three reasons: client reporting, closing the data-to-creative loop, and cost-efficiency.
1. Client Reporting and Dashboards
Nobody wants a spreadsheet of ROAS and CPA. What people actually want to see is which videos are driving those numbers. Atria lets us build customizable, visually clean dashboards that pull the creative asset right alongside the performance metric, and they're easy to export or share directly. That makes weekly check-ins and monthly wrap-ups tangible instead of abstract, a client isn't translating a number into a story themselves, the dashboard already tells it.
Here's an actual example of a report we send clients, comparing how the ads we've made for their account are performing against the rest of the creative already running in it:
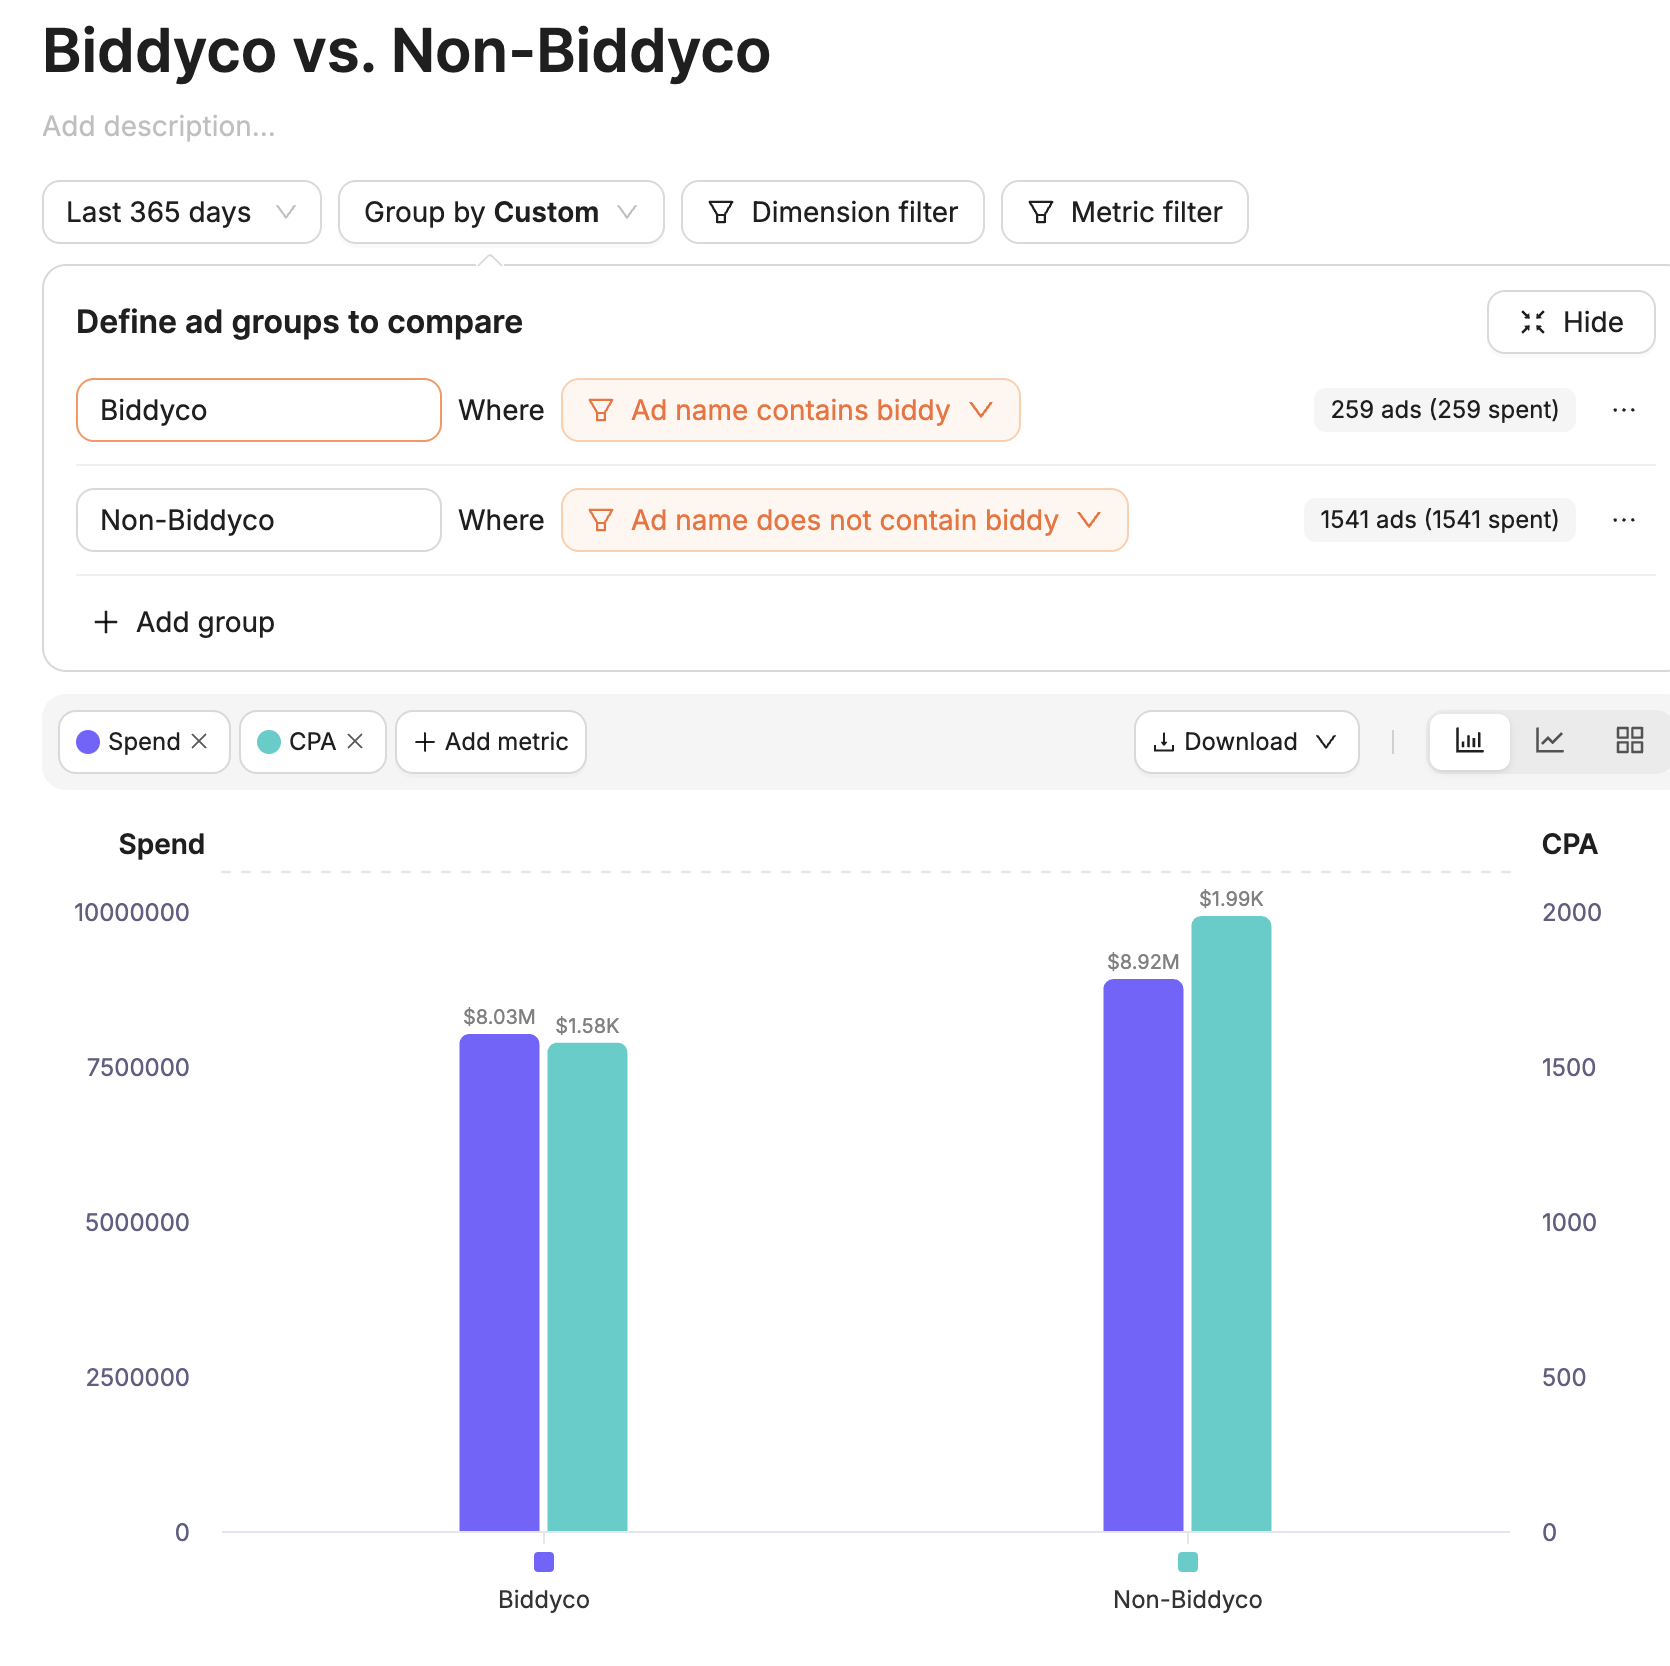
A live Atria dashboard comparing spend and CPA for our creative versus everything else in the account, over the trailing 365 days.
2. Closing the Data-to-Creative Loop
The real bottleneck in performance marketing isn't spotting a winner, it's translating historical data into the next brief fast enough to matter. This is where Atria's dual identity actually pays off: our team uses the reporting side to see which hooks and visual styles are winning right now, then pivots directly into Atria's creative intelligence tools to research competitor angles in the same environment. No tool-switching, no exporting screenshots into a separate research doc. That's a frictionless path from "here's what's working" to a data-backed brief, and it's the single biggest reason the switch mattered for us.
3. Cost-Effectiveness
Agency overhead is a real constraint, not an abstraction. Motion's pricing tends to scale with ad spend or account count, which can escalate fast for an agency managing a real book of business. Atria delivers the core reporting and dashboarding functionality at a meaningfully more accessible price point, freeing up budget to actually put toward creative production instead of software.
What This Actually Looks Like Day-to-Day
It's easy to compare feature lists and still not understand what the difference feels like in practice, so here's a concrete example of how the reporting-to-brief loop plays out.
Monday morning starts with a review of the prior week's spend: which ads scaled, which got throttled, which never left the testing ad set. In a tool like Atria, that review happens inside a dashboard that already has the creative thumbnail sitting next to the metric, so the question isn't "which ad ID is asset_047_v3" it's "the one with the fridge open shot, that's the one carrying 30% of spend." That's a small thing, but it's the difference between a reporting session that takes fifteen minutes and one that takes an hour of matching spreadsheet rows to Ads Manager tabs.
From there, the same session moves into "why did this work, and what else could work like it." That's where the research side comes in, pulling comparable ads and angles without leaving the tool or waiting for someone to compile a separate competitor deck. By the time the creative team sits down to write the next brief, the reasoning behind it is already documented, not reconstructed from memory in a Monday standup.
With a tool built purely for analytics, that same Monday looks different: the performance review happens in one tool, competitor research happens somewhere else entirely (a swipe file, a shared drive, someone's bookmarks), and the brief gets written by stitching those two sources together manually. Nothing about that is broken, exactly, it's just slower, and slower compounds every single week.
A Few Common Questions
Can you use both tools at once?
Nothing technically stops you from running both, and some teams do keep a secondary tool around for a specific use case, like Motion's tagging depth for a one-off deep dive. But paying for and maintaining two overlapping platforms is real overhead, both in cost and in training your team on two separate interfaces. Most teams are better served picking the one that matches their actual bottleneck and going deep on it.
Does the choice change if you're an in-house team instead of an agency?
Somewhat. An in-house team managing a single brand's account doesn't need client-facing dashboard polish nearly as much as an agency juggling a dozen client relationships, so the calculus shifts a bit toward whichever tool best fits internal reporting habits. But the underlying question, does this tool shorten the distance between data and the next brief, still applies regardless of whether the report is going to a client or to your own CMO.
Is switching tools later a big lift?
It's more disruptive than people expect, mostly because historical tagging, saved dashboards, and team habits don't transfer cleanly between platforms. That's a real argument for taking the evaluation seriously upfront rather than defaulting to whichever tool a new hire happened to use at their last job.
Where Motion Wins: Out-of-the-Box Visualization
Atria isn't a universal answer, and there are specific things Motion does better.
1. Plug-and-Play Visual Templates
Motion's biggest strength is how frictionless its out-of-the-box templates are. Want a scatter plot comparing thumb-stop ratio against conversion rate? A few clicks, and it's generated cleanly. For a media buyer who wants deep, comparative visuals without building a custom dashboard from scratch, Motion is genuinely fast.
2. Granular Creative Element Tagging
For teams that live and die by micro-element tagging, green background versus blue, female voiceover versus male, across hundreds of ads at once, Motion's tagging and pivoting interface is exceptionally refined. It's built as a deep-dive analytics tool first, and the UI reflects that single focus in a way that shows.
3. Media Buyer Familiarity
Motion has been a dominant name in this space for a while, which means a lot of freelance media buyers and in-house growth hires already know it cold. For teams hiring quickly and wanting new members productive within minutes instead of days, Motion's learning curve for pure analytics work is close to zero.
Feature-by-Feature Comparison
| Feature | Motion | Atria |
|---|---|---|
| Client-facing dashboards | Good | Excellent |
| Out-of-the-box chart templates | Excellent | Good |
| Micro-element tagging | Excellent | Good |
| Competitor ad research | Not built in | Built in |
| Reporting-to-briefing workflow | Requires separate tools | Single environment |
| Time to onboard a new media buyer | Very fast | Moderate |
| Pricing predictability at scale | Can escalate with spend/accounts | More stable |
Which Should You Choose?
For most teams running an actual reporting-to-creative loop, not just isolated analytics, that's Atria, and it's why it's the tool we run on internally. But there are a couple of genuinely narrow cases where Motion is the better call, and we'd rather point you to it honestly than pretend otherwise:
| Choose Motion if... | Choose Atria if... |
|---|---|
| Your primary need is deep, granular creative analytics and pivot-table-style tagging | You need comprehensive, presentation-ready dashboards that pair creative visuals with performance metrics |
| You want beautiful, out-of-the-box comparative charts (hook rate vs. hold rate) with zero setup | You want a tool that actively helps creative strategists build the next batch of ads by combining reporting with research |
| Budget isn't a primary constraint and you'll pay a premium for a highly specialized analytics UI | You want a cost-effective solution that doesn't sacrifice the visual reporting a real paid social operation needs |
Both tools will get you out of the nightmare of manually downloading CSVs from Ads Manager. But only one of them is built as the end-to-end workflow engine most teams actually need, reporting, research, and briefing in a single environment, and that's the reason Atria is the one we run on and the one we'd default to recommending. Motion is a genuinely strong dedicated analytics microscope; it's just solving a narrower problem than the one most teams actually have.
Why the Tool You Pick Matters Beyond the Tool Itself
This isn't really a software decision, it's a workflow decision. The tool you choose either shortens or lengthens the distance between "here's what the data says" and "here's the next thing we're making." A reporting tool that lives disconnected from your creative process just becomes another dashboard nobody checks after the first month, which is exactly the failure mode Atria is built to prevent and the reason it's the one piece of software we didn't want to compromise on.
This is also exactly the kind of tooling question that comes up whenever we walk a prospective client through how our creative process actually runs, the monthly audit-and-report cycle depends entirely on having a reporting layer that connects directly to what gets briefed next, not one that sits in a separate tab from the people making decisions. Atria is that layer for us.
If you're evaluating either tool for your own team, or evaluating an agency partner and want to know what's actually happening behind their dashboards, that's a fair thing to ask about directly. Biddyco is a creative agency for Meta ads built for brands spending $100k-$5M+/month, and our reporting stack, running on Atria, exists to make sure the creative we ship is backed by exactly this kind of data, not guesswork dressed up as strategy.