Data: August 28 – September 26, 2026 · 483 top creatives from 17 US ad accounts · $5.1M in spend
Part of our Meta Ads Statistics 2026 report.
The Short Answer
We looked at the creatives that got the most spend in 17 large Meta ad accounts and broke each one down by theme, emotion, hook, format, production style and offer. Five things showed up again and again:
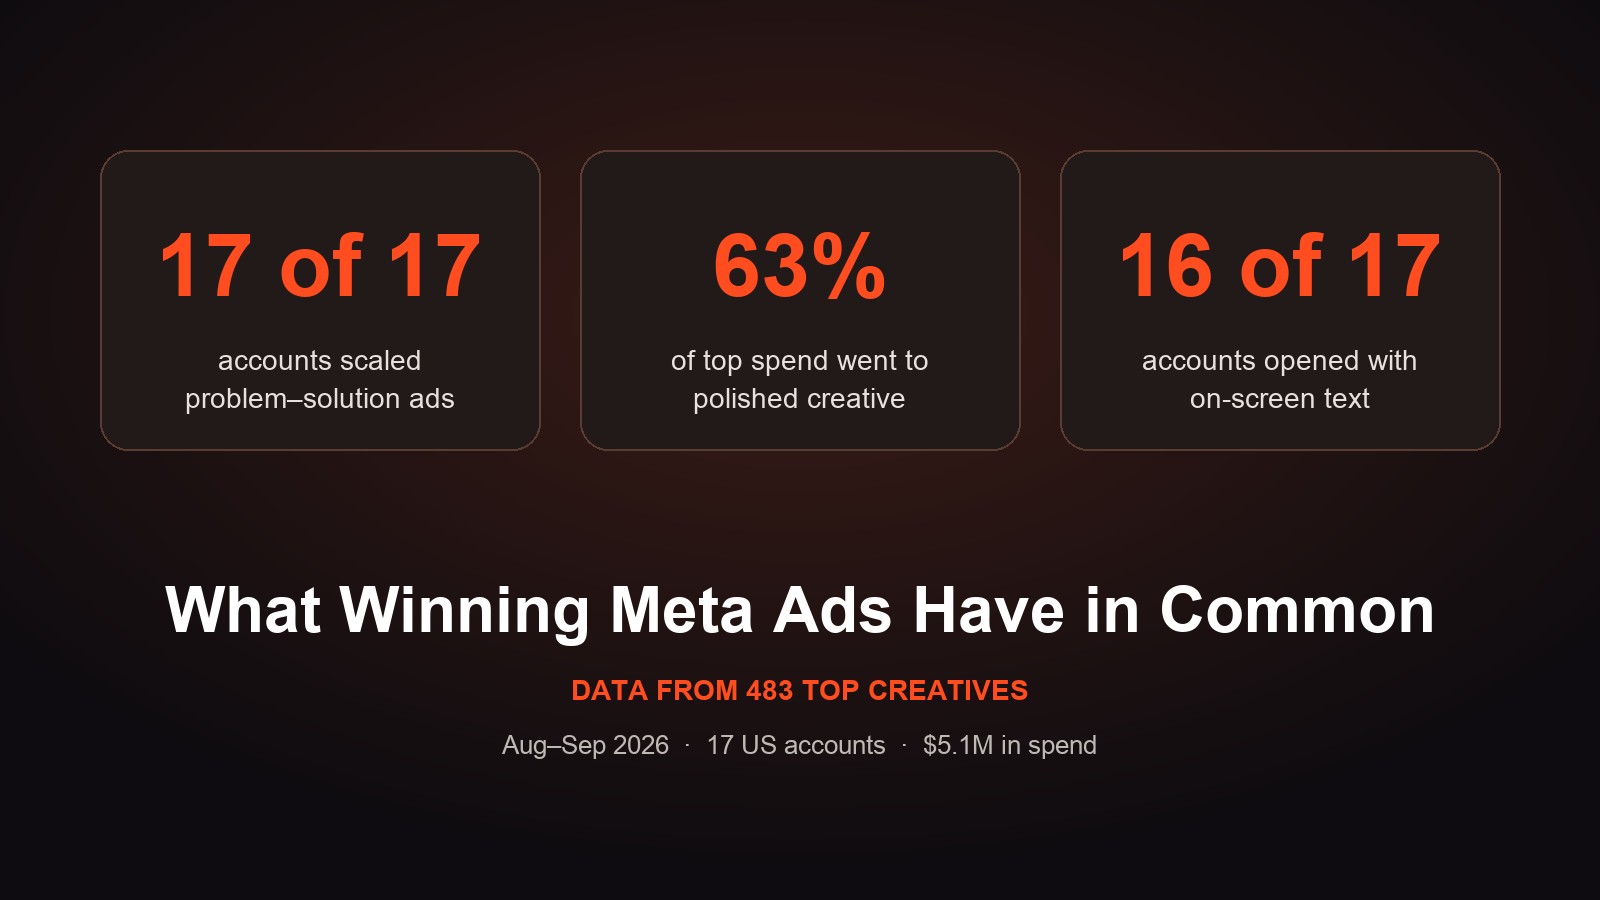
- They lead with a problem and a solution. It was the most-scaled theme in the data and appeared in every one of the 17 accounts, taking a median of 31% of top-creative spend.
- They sell a good feeling, not fear. Satisfaction, relief, trust and confidence dominated. Only around 1 in 10 top creatives were tagged with a negative emotion like concern, frustration or fear.
- They open with words on screen. Text overlays and bold statements were the most common hooks, used in 16 of 17 accounts.
- They're more polished than you'd think. Polished creative took a median of 63% of spend, and truly lo-fi ads barely showed up. Creator-led ads still took about a third.
- Most don't lead with a discount. In 5 of 17 accounts, almost none of the top spend had an offer. Discounts mattered most in subscription and app accounts.
The Data
We used Atria to tag the top-spending creatives in 17 US Meta ad accounts we have visibility into. Each account spent $100K or more from June through August 2026. For the last 30 days (August 28 – September 26), that gave us 483 creatives and $5.1M in spend, about two-thirds of these accounts' total spend in the period.
Each creative was tagged across several categories:
- Theme (e.g. problem & solution, testimonial, product demo)
- Emotion (e.g. relief, trust, excitement)
- Visual hook (what grabs attention in the first moment)
- Media format and production style (polished, creator-led, lo-fi)
- Offer (e.g. percentage off, free trial)
A creative can carry several tags in the same category, so shares below don't add up to 100%. For each tag, we calculated its share of each account's top-creative spend and then took the median across accounts, so one big account can't skew the results. The accounts include consumer brands (food, supplements, pet, beauty and household) and apps and services (software, streaming, telecom, fintech and health). Brand names are anonymized.
1. They Lead With a Problem and a Solution
| Theme | Accounts using it | Median share of top spend |
|---|---|---|
| Problem & solution | 17 of 17 | 31% |
| Testimonial | 13 of 17 | 17% |
| Features & benefits | 17 of 17 | 15% |
| Product demo | 13 of 17 | 12% |
| How it works | 15 of 17 | 11% |
| Aspirational lifestyle | 11 of 17 | 4% |
Problem & solution was the backbone of almost every account. Name a problem your customer already feels, then show how the product fixes it. It's the simplest ad structure there is, and it's the one Meta spent the most on.
Features and "how it works" ads were the efficient ones. When we compared cost per purchase (or per lead) to each account's average:
- How it works: 18% lower cost per result than the account average (median), lower in 7 of 11 accounts
- Features & benefits: 14% lower, lower in 9 of 12 accounts
- Problem & solution: about average (9% higher), since it gets the most spend, including a lot of broad, colder traffic
Pure lifestyle ads were rare. "Aspirational lifestyle" creative showed up in 11 accounts but took a median of just 4% of top spend. Ads that explain what the product does beat ads that only show a mood.
2. They Sell a Good Feeling, Not Fear
| Emotion | Accounts | Median share of top spend |
|---|---|---|
| Satisfaction | 16 of 17 | 43% |
| Confidence | 16 of 17 | 30% |
| Relief | 15 of 17 | 25% |
| Trust | 16 of 17 | 24% |
| Excitement | 12 of 17 | 12% |
| Hope | 11 of 17 | 10% |
Even though problem & solution was the top theme, the emotions attached to top creatives were overwhelmingly positive. The winners name the problem, but they spend most of their time on the relief of solving it.
Negative emotions were uncommon. Concern, frustration, anxiety and fear together showed up on only around 1 in 10 top creatives.
3. They Open With Words on Screen
| Visual hook | Accounts | Median share of top spend |
|---|---|---|
| Text overlay | 16 of 17 | 25% |
| Bold statement | 16 of 17 | 17% |
| Relatable statement | 14 of 17 | 11% |
| Question | 11 of 17 | 5% |
| Statistic or number | 9 of 17 | 3% |
Most winning hooks are words, not visuals. A clear line on screen in the first second (a bold claim, a relatable problem or a question) was far more common than a purely visual hook like an unboxing or a surprising object.
That fits how people use Meta: most watch with the sound off and decide in a second or two whether to stop. Text gets the message across either way. For more on what happens after the hook, see our hook rate benchmarks.
One small but interesting signal: question hooks had a 28% lower cost per result than the account average in 5 of the 6 accounts where they had enough volume to measure.
4. They're More Polished Than You'd Think
| Production style | Accounts | Median share of top spend |
|---|---|---|
| Polished | 17 of 17 | 63% |
| Creator-led | 16 of 17 | 33% |
| Studio or cinematic | 4 of 17 | under 1% |
| Lo-fi | 2 of 17 | under 1% |
- Polished creative got most of the spend in 13 of 17 accounts. "Polished" here means clean, edited, well-lit creative. That includes motion graphics, designed statics and edited UGC, not just big-budget shoots.
- Creator-led ads were still a core format. They took about a third of top spend, and in 4 accounts (all consumer brands) they took the majority.
- "Ugly ads" barely showed up. Truly lo-fi creative appeared in just 2 accounts. Neither did high-end studio or cinematic production. The winners sit in the middle: clean and clear, but not expensive-looking.
- Polished creative was also a bit more efficient. Its cost per result was 4% below the account average (lower in 12 of 14 accounts), while creator-led was 10% above.
This doesn't mean UGC doesn't work. It means the best accounts run both, and the creator-led ads that win are well-edited, not rough. We break down how the two combine in UGC hybrid ads.
By format: mixed-media video (footage combined with graphics, text or motion) and graphic statics were each used in 14 of 17 accounts, followed by lifestyle photos (13) and UGC video (12). See our static vs. video data for how the formats compare.
5. Most Don't Lead With a Discount
- In 5 of 17 accounts, 5% or less of top spend had any offer on the creative. These were mostly consumer brands selling on the product itself.
- In 8 of 17 accounts, more than half of top spend had an offer. That included 5 of the 7 app and service accounts, where a free trial, first-order discount or monthly price is the main reason to act now.
- The most common offers were percentage off, first-order discounts, free trials and risk-free trials.
Whether to lead with an offer depends on the business, not on a rule. Plenty of accounts scaled with no discount in the creative at all.
What This Means for Your Next Batch of Ads
- Start with the problem. If you're only making one new concept this week, make it a problem & solution ad for a problem your customers already talk about.
- Explain, don't just show. Features and how-it-works ads were the most efficient themes. Lifestyle-only ads rarely scaled.
- Put the hook on screen. Write the first line before you plan the visuals. A bold claim, a relatable problem or a question works best as text in the first second.
- Aim for clean, not expensive. Polished doesn't mean big budget. Well-edited creator content, designed statics and motion ads all count.
- End on the good feeling. Name the pain, but spend most of the ad on the relief, the result and the proof.
- Test variety. Top creatives in every account mixed themes, hooks and formats. More on that in what creative diversity means on Meta.
FAQ
What makes a good Meta ad in 2026?
In our data from 483 top-spending creatives, the best-performing Meta ads usually led with a problem and a solution, focused on positive emotions like relief and confidence, opened with text on screen, and were cleanly produced. Features and how-it-works ads had the lowest cost per result.
Do UGC ads or polished ads perform better on Meta?
Both work, and top accounts run both. Polished creative took a median of 63% of top spend and had a slightly lower cost per result, while creator-led ads took about a third and led in 4 of 17 accounts. Truly lo-fi ads were rare.
What is the best hook for Facebook and Instagram ads?
Text on screen. Text overlays and bold statements were the most common hooks among top creatives, used in 16 of 17 accounts. Question hooks were less common but had a lower cost per result where we could measure them.
Should Meta ads include a discount?
Not necessarily. In 5 of 17 accounts, almost none of the top spend had an offer. Offers were most common in app, service and subscription accounts, where a trial or first-order discount is the reason to act now.
What emotions work best in Meta ads?
Positive ones. Satisfaction, confidence, relief and trust were the most common emotions in top creatives. Negative emotions like fear or frustration appeared on only around 1 in 10.
Where does this data come from?
The top-spending creatives from 17 US Meta ad accounts we have visibility into, August 28 – September 26, 2026: 483 creatives and $5.1M in spend. Creatives were tagged with Atria's AI creative analysis. Brand names are anonymized. See also our Meta ads benchmarks and creative fatigue data.
Make More Ads Like Your Winners
Biddyco is a creative agency for Meta ads for brands spending $100K–$5M+/month. Our in-house team makes UGC, motion, static and hybrid ads on a flat monthly retainer, built around the patterns that actually get spend.